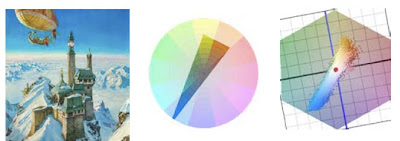
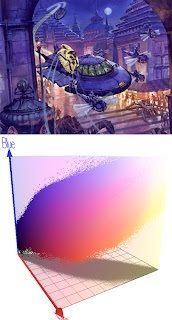
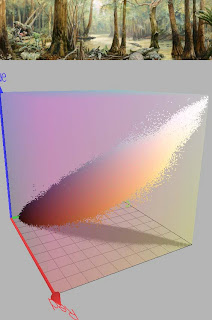
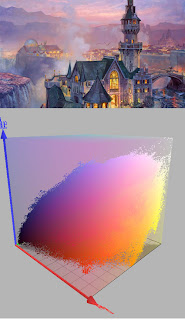
(If this embedded video doesn't play, try this link to YouTube). Each painting will be followed by an irregular shape that represents the range of colors used within that composition.
If you’ve read this blog for a while or dug back in the archives, you may remember seeing how we can chart a color scheme as a shape or gamut that takes up part of a color wheel. Everything outside the gamut is left out of the composition.
 The painting Palace in the Clouds, above, has a gamut limited to intense blue, opposed by fairly dull reds and yellows, and some fairly dull dark greens.
To the right of that is a computer-generated image made by sampling all the pixels and charting them on a color wheel. The software was created by Phillipe Colantoni, and is available for Windows users at couleur.org.
 We can also combine the value or lightness data to see the color scheme as a 3D representation inside an RGB cube. The RGB color space is created by graphing red, green, and blue as three separate vectors in XYZ space. (The green vector above is hidden by the gamut.)
Where the vectors intersect is pure black. At the opposite corner is pure white. In this configuration, the secondaries are cyan, magenta, and yellow, which would lie on the plane between each of the two vectors. A pure yellow, for example, would be on the plane formed by red and green (the horizontal plane in this view).
 By comparing each of the paintings with its gamut in RGB color space, and then comparing the gamuts to each other, you can see how the gamuts vary. The gamut for Crocodile Swamp is narrower because the color scheme is more limited. There are hardly any blues.
 The yellow windows in this scene show up as a scattering of yellow dots at the bottom of the gamut.
------
Software by P. Colantoni at couleur.org.
Animation by Lester Yocum at lesteryocum.com
Previously on GurneyJourney: Color Wheel Masking Update
No comments:
Post a Comment